The DHS Program User Forum
Discussions regarding The DHS Program data and results
Home » Data » Weighting data » How to Weight Data in R
How to Weight Data in R [message #179] Thu, 21 March 2013 16:17 Go to next message
Jewel is currently offline  Jewel
Messages: 1
Registered: March 2013
Location: United States
Member
I am trying to use the package "Survey" in R to do a DHS analysis, but I want to be sure that I am setting up the weights properly.
My general code is as follows:

weight<-mydhsdata$v005/1000000
> data <- svydesign(id = mydhsdata$caseid, strata=mydhsdata$v021,
+ weights = weight,
+ data=mydhsdata)


If anyone has any insights on how to set up the dataset in R, I would appreciate the help!
Re: How to Weight Data in R [message #198 is a reply to message #179] Mon, 25 March 2013 10:52 Go to previous messageGo to next message
Bridgette-DHS is currently offline  Bridgette-DHS
Messages: 3017
Registered: February 2013
Senior Member
Here is a response to your question, from one of our DHS experts, Tom Pullum.

We cannot offer much support for R.

Yes, V005 is always the weight variable.

The psu or cluster variable is V001 or V021. These are generally exactly the same--that is, they are duplicates. If in any doubt, use V001. There will typically be several hundred clusterS. Your code used v021 as the stratification variable, and that would be a mistake.

The stratification variable is not always clearly identified, but in virtually all surveys the strata are the combinations of region (the first subnational unit) and urban/rural (always v025). Region and strata are usually given by v022, v023, or v024. (v101 is a duplicate of region.) Take a quick look at those three variables. There will typically be about twice as many strata as regions--often one less than twice as many, because the capital region may be completely urban. The number of strata will typically be in the rage of 20 to 40.

If you have difficulty identifying the stratification variable for a specific survey, please contact DHS.

I hope this helps.

Bridgette-DHS

Re: How to Weight Data in R [message #706 is a reply to message #179] Thu, 22 August 2013 16:13 Go to previous messageGo to next message
onetwo
Messages: 1
Registered: August 2013
Location: United States
Member
Hi Jewel

I can't unfortunately answer to your question but since you seem to have used DHS data in R, I just wanted to ask how you manage to read the data. I have no conventional stat package in my computer so I have to totally rely on R. When I write the following code to simply read the stata data, I got errors messages:

> mydata <- read.dta("c:/Births/CDBR50DT/CDBR50FL.dta")
There were 50 or more warnings (use warnings() to see the first 50)
> warnings ()
Warning messages:
1: In `levels<-`(`*tmp*`, value = if (nl == nL) as.character(labels) else paste0(labels, ... :
duplicated levels in factors are deprecated
...

Thanks for helping if possible!

And if anybody else can help, I'll be glad!
Re: How to Weight Data in R [message #770 is a reply to message #179] Sat, 14 September 2013 11:02 Go to previous messageGo to next message
Trevor-DHS is currently offline  Trevor-DHS
Messages: 787
Registered: January 2013
Senior Member
To follow up on how to weight the data in R and use the sample design, I use the following:

DHSdesign <- svydesign(id = mydata$v021, strata=mydata$v022, weights = mydata$v005/1000000, data=mydata)

Note that the id above is the cluster id (v021), not the caseid. The strata are given by v022, but as Tom Pullum noted in his reply (posted by Bridgette), you need to check the stratification to use. Sometimes v022 gives the stratification to use, sometimes v023, and sometimes neither are set and you have to create it from v024 (region) and v025 (urban/rural). See the sampling design appendix in the DHS final reports for each survey for information on the stratification used in the survey.

Once you have set up the design, you can use it as follows:
svymean(~v201, DHSdesign)
cv(svymean(~v201, DHSdesign))
confint(svymean(~v201, DHSdesign))
svymean(~factor(v025), DHSdesign)

Regards. Trevor
Re: How to Weight Data in R [message #771 is a reply to message #706] Sat, 14 September 2013 11:44 Go to previous messageGo to next message
Trevor-DHS is currently offline  Trevor-DHS
Messages: 787
Registered: January 2013
Senior Member
Hi Onetwo,

The warnings you are getting are because R converts categorical variables with labels into factors, but some variables have the same label for more than one category. R appears to convert these into a single level in the factor it creates. Some of these cases are because there are blank labels defined, and so all categories get converted into a single level in the factor.

You can avoid this by not converting categorical variables into factors. You can do this by using:

mydata <- read.dta("c:/Births/CDBR50DT/CDBR50FL.dta", convert.factors=FALSE)

and then convert any variables that you want to use into factors when you need them. This will avoid the warning messages that are produced in the conversion process.

Cheers. Trevor
Re: How to Weight Data in R [message #12663 is a reply to message #770] Wed, 28 June 2017 17:54 Go to previous messageGo to next message
dhswes is currently offline  dhswes
Messages: 6
Registered: June 2017
Member
Hello:

I am trying to calculate the % of urban households that use a flush toilet connected to a sewer. I am using the Survey package in R. Here is some sample code using the 2015 DHS for Zimbabwe:

zimsurvey <- svydesign(id = zim$hv001, strata=zim$hv023, weights = zim$hv005/1000000, data=zim)

svyby(~hv205, ~hv025, zimsurvey, svymean)

This gives me (partial results):

hv025 hv205 flush to piped sewer system
urban urban 0.75060493
rural rural 0.01380543

This proportion is much higher than what is reported in the DHS stat compiler (35.6%). I must be using the sampling weights incorrectly. Any insight?

Thanks,

Michael
Re: How to Weight Data in R [message #12773 is a reply to message #12663] Tue, 11 July 2017 18:52 Go to previous messageGo to next message
Trevor-DHS is currently offline  Trevor-DHS
Messages: 787
Registered: January 2013
Senior Member
Your approach is correct, but you are comparing it to the wrong number(s). In the DHS report and in the STATcompiler the flush toilets connected to a sewer system are broken down into those that are not shared (35.6% in urban areas) and those that are shared (39.5%) - sum = 75.1%
Re: How to Weight Data in R [message #13105 is a reply to message #12663] Wed, 20 September 2017 18:51 Go to previous messageGo to next message
dhswes is currently offline  dhswes
Messages: 6
Registered: June 2017
Member
Thanks, Trevor. I am just seeing this now. I will go back into my data, and let you know if I have any additional questions using R with DHS data.

Michael
Re: How to Weight Data in R [message #16337 is a reply to message #770] Sat, 15 December 2018 18:29 Go to previous messageGo to next message
correaem is currently offline  correaem
Messages: 3
Registered: December 2018
Location: Cincinnati
Member
Hi Trevor,

I initially followed this post indications, Since I am doing some preliminary hiv research but I've got different results using R. These intervals are what I've got from running:

SAS (left) VS SPSS (right)
/index.php?t=getfile&id=1020&private=0

R Studio using
/index.php?t=getfile&id=1021&private=0

Notes:
1. It is exactly the same table I hva pre-processed in R and the exported as xlsx for 3rd party tools.
The line I use
DHSdesign <- svydesign(id = ~PSU, strata=~Strata, weights = ~hivweight, data=fLogitFiltered2)
V021 is used as PSU and V023 for the strata after checking the design survey

2. For SAS and SPSS I followed the recommendation from the official source of DHS https://www.youtube.com/watch?v=NNg8HD_lKow
3. As you could see, SPSS and SAS give the same results totally different from R, unfortunately.

Any advice would be great, thanks in advance
Esteban
Re: How to Weight Data in R [message #16338 is a reply to message #16337] Sun, 16 December 2018 13:43 Go to previous messageGo to next message
Trevor-DHS is currently offline  Trevor-DHS
Messages: 787
Registered: January 2013
Senior Member
You have a different list of variables. In R you have hivtestedYes instead of hivtestedNo. You might want to check that first.
Re: How to Weight Data in R [message #16339 is a reply to message #16338] Sun, 16 December 2018 15:18 Go to previous messageGo to next message
correaem is currently offline  correaem
Messages: 3
Registered: December 2018
Location: Cincinnati
Member
Hi Trevor,

Thanks for the quick answer. But I noted that and already changed the hivtested's reference using relevel to "Yes". However, results keep being totally different than SAS and SPSS.

/index.php?t=getfile&id=1022&private=0

I'm starting to think svydesign is not multi-stage set-up yet. If you have additional feedback it will be welcome.

Thanks in advance,
Re: How to Weight Data in R [message #16340 is a reply to message #16339] Sun, 16 December 2018 23:34 Go to previous messageGo to next message
Trevor-DHS is currently offline  Trevor-DHS
Messages: 787
Registered: January 2013
Senior Member
I'm not sure you need the 'exp'. Have you tried just using
confint(surv.females.logit)
or
confint.default(surv.females.logit)
Re: How to Weight Data in R [message #16368 is a reply to message #16340] Fri, 28 December 2018 14:10 Go to previous messageGo to next message
correaem is currently offline  correaem
Messages: 3
Registered: December 2018
Location: Cincinnati
Member
Yes I do. Since I am analyzing binomial response in a non linear dataset. I am using the logit function for the response variable of the probability of success on certain risk factors.

As DHS recommend. Any estimation different that only frequencies such as odds ratios or statistical significance values, needs to include the multistage sampling. The problem here is that I can reach same values from SAS and SPSS but not in R. For some reasons or missings, my currently setup of svydesign and its glm cannot take into account the PSU, strata rather than only individual weights.

Finally, me as computer engineer and devote to open sources tools, always want to pursue open-source frameworks in python and R to solve problems .

BR
Re: How to Weight Data in R [message #17443 is a reply to message #179] Tue, 19 March 2019 10:20 Go to previous messageGo to next message
jordan is currently offline  jordan
Messages: 1
Registered: March 2019
Member
I follow the code stated in the "Guide to DHS Statistics" to weight the data in R. And it gave me this result

DHSdesign <- svydesign(id = stata.file$v021, strata=stata.file$v022, weights = stata.file$V005/1000000, data=stata.file)
Error in svydesign.default(id = stata.file$v021, strata = stata.file$v022, :
Must provide ids= argument

What should I do?
Re: How to Weight Data in R [message #17444 is a reply to message #17443] Tue, 19 March 2019 10:52 Go to previous messageGo to next message
Trevor-DHS is currently offline  Trevor-DHS
Messages: 787
Registered: January 2013
Senior Member
It looks like it doesn't like the parameter id=, but wants ids=. Try
DHSdesign <- svydesign(ids = stata.file$v021, strata=stata.file$v022, weights = stata.file$v005/1000000, data=stata.file)
I just tested on my system, though, and it accepts id=, so I'm not sure that is your problem.

Also look at how the variable names are spelled. Usually they are all lower case, but you have V005 with a capital letter in your post, but this should probably be v005 (as I used it above). I think this is maybe your source of error.
Re: How to Weight Data in R [message #19257 is a reply to message #17444] Sun, 17 May 2020 01:06 Go to previous messageGo to next message
Wahyu dh is currently offline  Wahyu dh
Messages: 3
Registered: May 2020
Member
I would like to ask about weighting data in R. I checked the design survey for the strata in indonesia dhs final report. It says that the strata is using the V024 or region (province) and the type of residence V025 (urban rural). And all the data in V022 and V023 is missing. So how to create the strata from V024 and V025? Because from the data there's no such that variable.
And then, i would like to ask about case id and V021. Bridgette said before that it is generally the same. But in this data, it is totally different. The case id is range 1-24 while V021, the range is 1-1970. Which one should i use for the id?
Thank you
Re: How to Weight Data in R [message #19259 is a reply to message #19257] Sun, 17 May 2020 12:38 Go to previous messageGo to next message
Trevor-DHS is currently offline  Trevor-DHS
Messages: 787
Registered: January 2013
Senior Member
1) To create a stratum variable just use V024*2+V025
2) caseid and v021 are not the same. v001 and v021 are usually the same.
caseid is a string variable constructed from the cluster number, household number and woman's line number.
v001 is the cluster number and v021 is the primary sampling unit number (usually the same as the cluster number).
Re: How to Weight Data in R [message #19261 is a reply to message #19257] Mon, 18 May 2020 02:06 Go to previous messageGo to next message
Wahyu dh is currently offline  Wahyu dh
Messages: 3
Registered: May 2020
Member
Oh i see. Thank you so much for the fast respond and the answer. It really helps. Once again. Thank you :)
Re: How to Weight Data in R [message #19681 is a reply to message #770] Sat, 01 August 2020 06:39 Go to previous messageGo to next message
Sajhama is currently offline  Sajhama
Messages: 28
Registered: July 2017
Member
Hello there,

I have been trying to use R for DHS, otherwise was a SPSS person. I am familiar with R commander to be more precise.

While trying to weigh data or use complex sample, the following command that you have written in your above messages didn't showed weighted data for me. The weighted and non weighted were same. I think the code have gone wrong somewhere. Please let me know on this for improvement. Thank you in advance.
Below is the code and have attached screenshot of both the weighted and unweighted data. Look forward.
DHSdesign <- svydesign(ids = DHS2016Nepal$HV021, strata=DHS2016Nepal$HV022, weights = DHS2016Nepal$HV005/1000000, data=DHS2016Nepal).... is for complex sample and

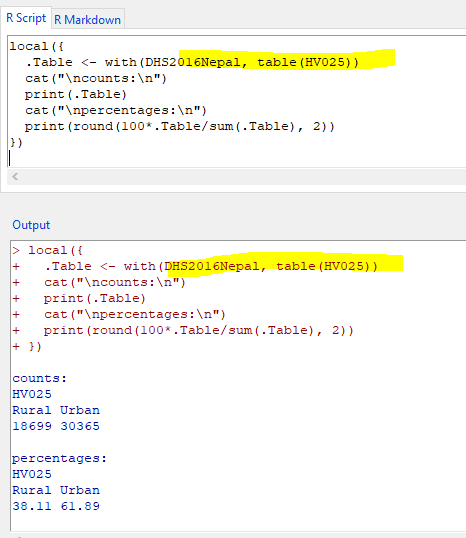
command for unweighted is below
local({
.Table <- with(DHS2016Nepal, table(HV025))
cat("\ncounts:\n")
print(.Table)
cat("\npercentages:\n")
print(round(100*.Table/sum(.Table), 2))
})

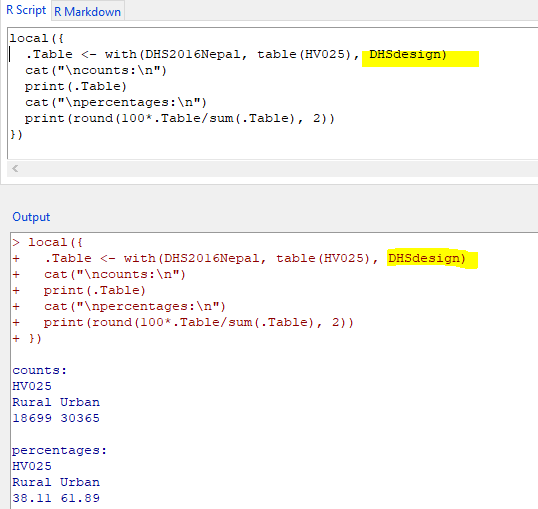
command for weighted is below:
local({
.Table <- with(DHS2016Nepal, table(HV025), DHSdesign)
cat("\ncounts:\n")
print(.Table)
cat("\npercentages:\n")
print(round(100*.Table/sum(.Table), 2))
})

/index.php?t=getfile&id=1578&private=0
/index.php?t=getfile&id=1577&private=0

[Updated on: Sat, 01 August 2020 06:44]

Report message to a moderator

Re: How to Weight Data in R [message #19705 is a reply to message #19681] Tue, 04 August 2020 15:39 Go to previous message
Bridgette-DHS is currently offline  Bridgette-DHS
Messages: 3017
Registered: February 2013
Senior Member
Following is a response from DHS Senior Sampling Specialist, Mahmoud Elkasabi:

I do not see any problem with the svydesign function. I believe the problem is with the with function you are using for the weights estimates. I don't think you can use the svydesign with the with function. You should use the svy functions from the survey package. For example, for your analysis I would imagine a function as follows:

prop.table(svytable(~HV025,design=DHSdesign))
Previous Topic: Pooling 3 rounds of DHS Nepal -- weights?
Next Topic: Applying weights for HIV Prevalence
Goto Forum:


Current Time: Thu Mar 28 14:14:48 Coordinated Universal Time 2024