| Labeling mistakes in exposure to mass media variables in Zambia 2007 stata dataset [message #2663] |
Sun, 03 August 2014 12:00  |
 ykang12
Messages: 8
Registered: July 2014
Location: USA
|
Member |
|
|
I am Yunhee, graduate student of Johns Hopkins School of Public Health.
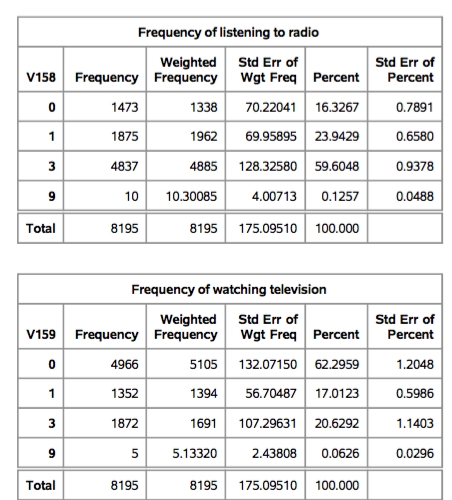
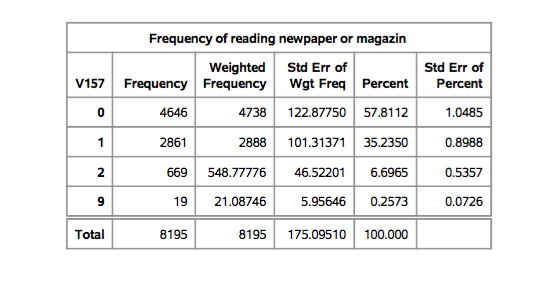
I have been doing data analysis with Zambia 2007 DHS dataset (stata format) and I wanted to know exposure to mass media among adolescent groups by tabulating such variables (v157,v158, v159). But I found labeling mistakes below and questions/answers seemed to be inconsistent with questions in DHS questionnaires. Could you help me clear about this?
< STATA dataset>
. tab v157
frequency of reading |
newspaper or magazine | Freq. Percent Cum.
------------------------+-----------------------------------
no education, preschool | 883 55.60 55.60
primary | 233 14.67 70.28
secondary | 261 16.44 86.71
higher | 209 13.16 99.87
9 | 2 0.13 100.00
------------------------+-----------------------------------
Total | 1,588 100.00
: their answers were recorded as 0,1,2,3,9, which is not consistent with Zambia questionnaire itself and even compared with other countries' dataset.
< DHS questionnaires>
Do you read a newspaper or magazine almost every day, at least once a week, less than once a week or not at all?
ALMOST EVERY DAY . . . . . . . . . . .1
AT LEAST ONCE A WEEK . . . . . . . . .2
LESS THAN ONCE A WEEK . . . . . . . . 3
NOT AT ALL . . . . . . . . . . . . . .4
|
|
|
|
|
|
| Re: Labeling mistakes in exposure to mass media variables in Zambia 2007 stata dataset [message #12649 is a reply to message #2668] |
Wed, 28 June 2017 09:57  |
dab000@mail.harvard.edu
Messages: 2
Registered: July 2016
|
Member |
|
|
Hello Bridgette,
I am having similar problems to what is described above for V157-V159 of the Kenya DHS for 2003 and 2008 - the response options in the dataset range from 0 to 3, rather than the options in the questionnaires, which range from 1 to 4 in the surveys, and tabulations of these responses do not cleanly map onto published results. For example, the final report for the Kenya DHS 2003 survey says that 22.5% of women read the newspaper at least once a week, 28.8% watch television at least once a week, and 75.1% listen to the radio once a week. However, this does not match the results I have calculated below.
I am not having problems reproducing other results, and I am also not having a problem reproducing these statistics in KDHS 2014 (although there is still a discrepancy in the response options in the dataset vs. the response options in the questionnaire.
Any advice or insights into this issue?
|
|
|
|
|
|
 Members
 Search
 Help
Help Register
 Login
Login Home
Home


")
