| Inconsistencies in heights between NFHS-3 NFHS-4 [message #24208] |
Tue, 15 March 2022 13:16  |
MaryH
Messages: 2
Registered: March 2022
|
Member |
|
|
Hi all,
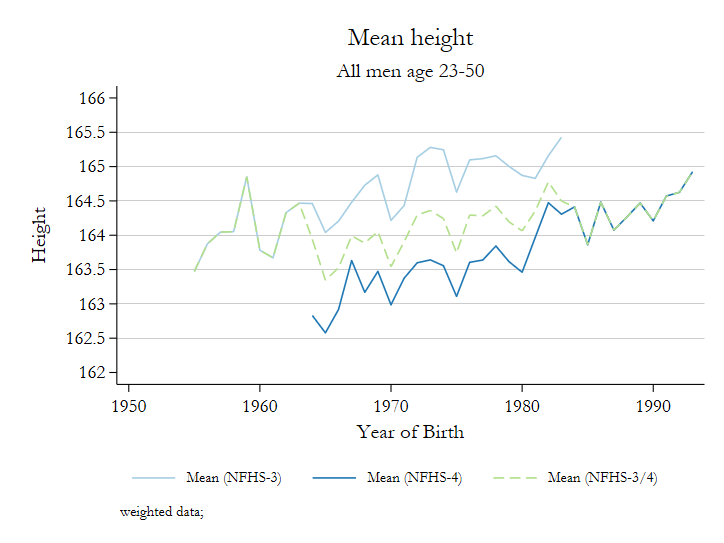
I was hoping someone might be able to help explain some inconsistencies we found when working on the 2005/06 and 2015/16 DHS Surveys for India (NFHS-3 and NFHS-4) with regards to average heights by birth cohort.
When plotting (weighted) national-level average heights for men (e.g. aged 23-50) for each year of birth for both waves, it is evident, that the line obtained using NFHS-4 data consistently lies 2 cm below the curve obtained from using data of the NFHS-3. For instance, the average height for people born in 1980 is 163.5cm according to NFHS-4 but 165cm according to the NFHS-3. Yet, the two lines do not converge for "younger" cohorts suggesting that this difference is unlikely to be driven by an age-effect (which usually sets in after age 40). Furthermore, height appears to be measured in the same way for both waves and the same cannot be observed for women's height. I unfortunately was not able to find any information in the corresponding DHS-reports or online. Does someone have an idea how this may come about?
Thank you in advance for your time and comment!
Mary

|
|
|
|
| Re: Inconsistencies in heights between NFHS-3 NFHS-4 [message #24435 is a reply to message #24208] |
Sun, 15 May 2022 14:59   |
MaryH
Messages: 2
Registered: March 2022
|
Member |
|
|
Dear All,
a few weeks ago I noted that there appear to be discrepancies in (male) height between NFHS-3 and NFHS-4. Since the same pattern curiously also emerges when comparing NFHS-4 to NFHS-5, I thought I would update this post and hope that someone might have an explanation.
Below the plot for men suggests that male height in NFHS-4 consistently lies 2 cm below male height in NFHS-3. And again, male height in NFHS-5 consistently lies 1 cm below average male height from NFHS-4. This means that, taking all men born in any given year, they appear shorter in each successive wave. In contrast, for women, there is no wave-related discrepancy in height. Instead the curves are overlaid and any differences appear consistent with sampling variation.
I wondered if someone might have any clues on why male height appears to be falling over time? Should the level-differences be subject to some sort of re-scaling?
Thank you in advance for your answers!
|
|
|
|
|
|
|
|
|
|
 Members
 Search
 Help
Help Register
 Login
Login Home
Home


