| Re: Labeling mistakes in exposure to mass media variables in Zambia 2007 stata dataset [message #12649 is a reply to message #2668] |
Wed, 28 June 2017 09:57   |
 dab000@mail.harvard.edu
Messages: 2
Registered: July 2016
|
Member |
|
|
Hello Bridgette,
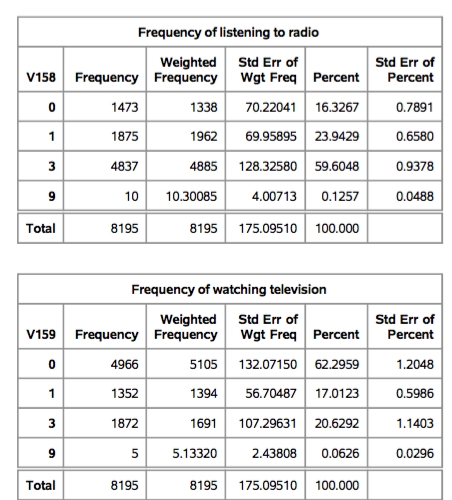
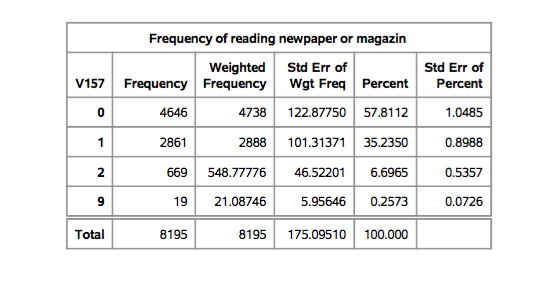
I am having similar problems to what is described above for V157-V159 of the Kenya DHS for 2003 and 2008 - the response options in the dataset range from 0 to 3, rather than the options in the questionnaires, which range from 1 to 4 in the surveys, and tabulations of these responses do not cleanly map onto published results. For example, the final report for the Kenya DHS 2003 survey says that 22.5% of women read the newspaper at least once a week, 28.8% watch television at least once a week, and 75.1% listen to the radio once a week. However, this does not match the results I have calculated below.
I am not having problems reproducing other results, and I am also not having a problem reproducing these statistics in KDHS 2014 (although there is still a discrepancy in the response options in the dataset vs. the response options in the questionnaire.
Any advice or insights into this issue?
 
|
|
|
|