| cannot reproduce TFR using R-package DHS.rates [message #18058] |
Mon, 02 September 2019 03:27  |
cfq
Messages: 4
Registered: September 2019
|
Member |
|
|
Hi all,
I am trying to reproduce the TFR by India states with the data set IAIR23SV. I am using the R-package DHS.rates and the function fert(). But the TFR values I got are very different from the STATcompiler.
My R code:
##-------------------------------
# read in DHS data. I resave the SPSS file into csv format, nothing else is changed
data.full <- read.csv("IAIR23SV.csv", header = TRUE, stringsAsFactors = FALSE, strip.white = TRUE)
# clean the column names of the data file to fit to the fert() function
new.names <- names(data.full)
new.names <- tolower(new.names)
new.names <- gsub(".", "_", new.names, fixed = TRUE)
names(data.full) <- new.names
# ger TFR
library(DHS.rates)
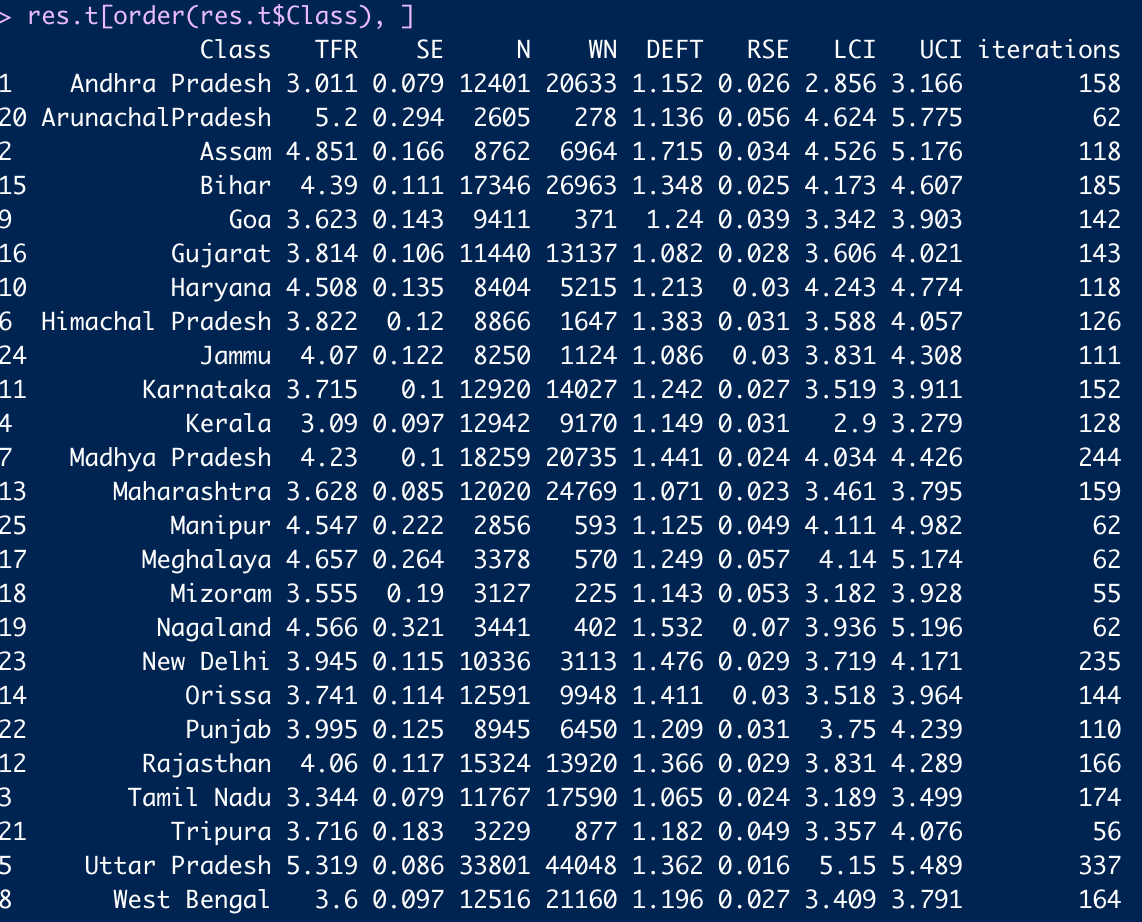
res.t <- fert(data.full, Indicator = "tfr", JK = "Yes", Class = "v024")
res.t[order(res.t$Class), ] #show results
##-------------------------------
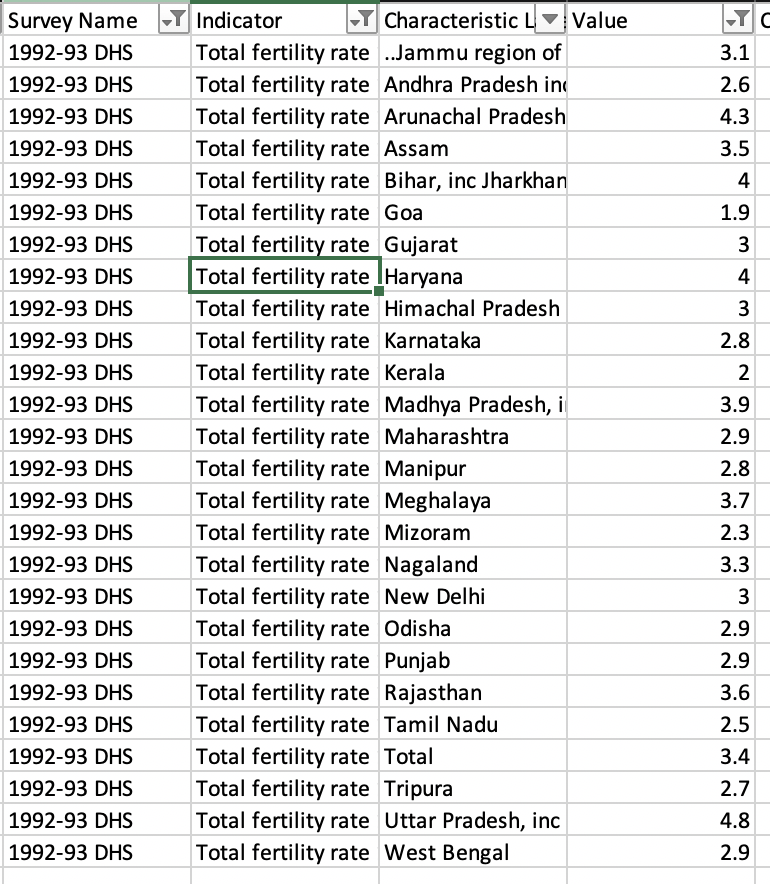
Attached are the screen shot of my R code output, and the STATcompiler. You can see none of the TFR values are the same.
There is no error message when I run my R code. Could any one let me know what cause the difference and how can I change my R code in order to get the same results as the STATcompiler? Thanks!
[Updated on: Mon, 02 September 2019 03:27] Report message to a moderator |
|
|
|
|
|
|
|
| Re: cannot reproduce TFR using R-package DHS.rates [message #18074 is a reply to message #18073] |
Thu, 05 September 2019 07:08  |
cfq
Messages: 4
Registered: September 2019
|
Member |
|
|
Hi Bruno,
Thanks for the helpful reply! I post my updated R code here:
My R code:
##-------------------------------
# read in DHS data. I resave the SPSS file into csv format, nothing else is changed
data.full <- read.csv("IAIR23SV.csv", header = TRUE, stringsAsFactors = FALSE, strip.white = TRUE)
# clean the column names of the data file to fit to the fert() function
new.names <- names(data.full)
new.names <- tolower(new.names)
new.names <- gsub(".", "_", new.names, fixed = TRUE)
names(data.full) <- new.names
# ger TFR
library(DHS.rates)
res.t <- fert(data.full, Indicator = "tfr", JK = "Yes", Class = "v024",
# this is the new line to indicate the data is for ever-married women and the adjustment vector name is awfactr
EverMW = "Yes", AWFact = "awfactr")
res.t[order(res.t$Class), ] #show results
##-------------------------------
Unfortunately, the awfactr (all-women factor for region) is empty. But otherwise it should be able to reproduce the results. Thanks!
|
|
|
|
|
|
 Members
 Search
 Help
Help Register
 Login
Login Home
Home


")
