Home » Countries » Bangladesh » Number of respondents mismatch in dataset and published report
| Number of respondents mismatch in dataset and published report [message #9665] |
Mon, 02 May 2016 02:35  |
 gkibria1@jhu.edu
Messages: 1
Registered: May 2016
Location: Baltimore, MD, USA
|
Member |
|
|
Hi
I was using the dataset of DHS 2014 of Bangladesh for a paper in my university. I already took permission of that. I was looking also at the published Bangladesh Demographic and Health Survey 2014 by the USAID. Wne I looked into the table 7.2 (page number 75) of the published report/book, I found that the number of respondents living in urban area was 4,709 and 12,149 in rural area. But when I was analyzing the dataset (in stata) BDIR70FL.DTA, I found the number was mismatch (6,1666 in urban and 11,693 in rural). Can you please help me to explain this?
Regards,
Kibria
|
|
|
|
|
|
|
|
| Re: Number of respondents mismatch in dataset and published report [message #12425 is a reply to message #12423] |
Mon, 15 May 2017 11:22  |
Bridgette-DHS
Messages: 3230
Registered: February 2013
|
Senior Member |
|
|
Following is a response from Senior DHS Stata Specialist, Tom Pullum and DHS Senior Research Associate, Shireen Assaf:
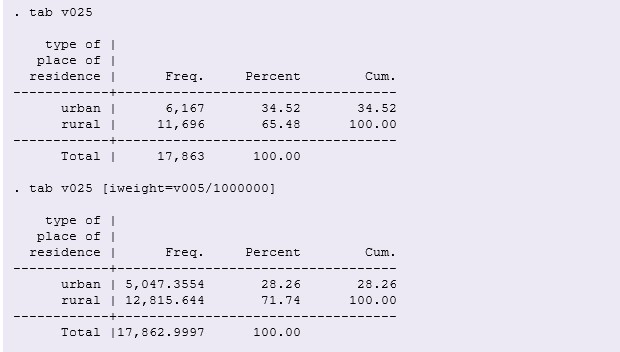
The difference between the 6167 and the 5047 is completely due to the use of weights. Below I will paste the results in Stata, first without weights and second with weights, using BDIR70FL.dta. I do this with iweight but you can also do it with pweight, svyset, and svy.
To produce the weighted table in R, you would need to use the survey package. The following lines should help you get started.
library(survey)
# install and load the survey package
options(survey.lonely.psu="adjust")
# to fix the issue with strata with single PSU
# adjust will center the stratum at the population mean

data$wt = data$v005/1000000
# create the weight variable

mydesign<-svydesign(id=data$v021, data=data, strata=data$v023,  weight=data$wt, nest=T)
# set the survey design using the uploaded data (named data), the cluster (v021), the strata (v023) , and the weight (wt).
# then use svymean or svytable to get the weighted proportions and frequencies of your variables.  See the survey package documentation for further details.
-
 Attachment: tab-v025.jpg
(Size: 28.26KB, Downloaded 1080 times)
[Updated on: Mon, 15 May 2017 11:23] Report message to a moderator |
|
|
|
Goto Forum:
Current Time: Tue Jan 13 22:45:29 Coordinated Universal Time 2026
|
 Members
 Search
 Help
Help Register
 Login
Login Home
Home


")
