Home » Topics » Malaria » How to declare data survey with complex design by Stata
| How to declare data survey with complex design by Stata [message #11180] |
Wed, 16 November 2016 02:06  |
|
|
Hello,
It's been a pleasure talking with you. I am a student who working my thesis by STATA. Could you please share your wide experience and knowledge to explain my research? My study as following: I have collected of massive data from National Institute for Health Research and Development, Ministry of Health. The participants of this research are households from all over of the country. The survey in 2007 managed to visit the 17.150 block census and collect 258.284 households and managed to bring together 972.989 individuals. Furthermore, in the health basic research data 2013, the team has been found, some block census and visited some 11.986 (99.9%) in the 33 Provinces, 497 districts/cities. The number of households is 294.959 of 300,000 (98.3%) by the number of household members 1,027,763 people.
Based on secondary data survey in 2007 and 2013 above, to describe health status in the country so, I would like to ask you, how to declare the data survey by STATA with design complex.?
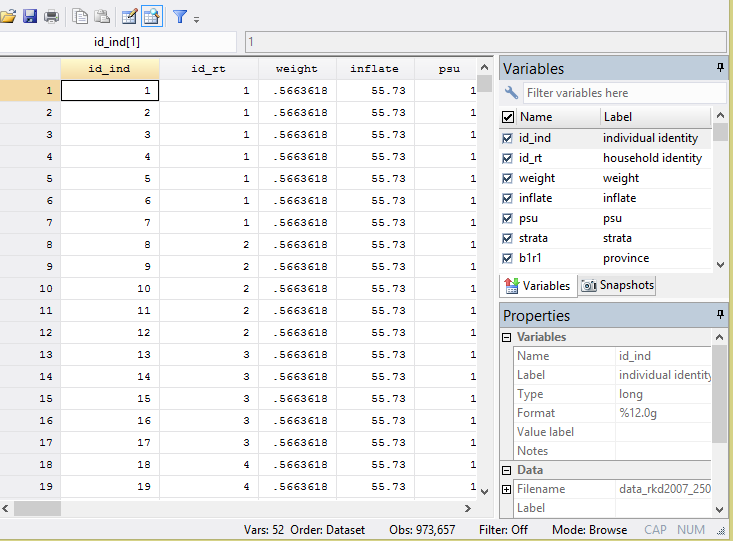
In 2007 survey, We have found component like these:

"weight
inflate
PSU (primary sampling unit)
Strata"
Then We declare the data survey like below
Code:
svyset, clear
svyset PSU [pweight= inflate],psu(PSU)
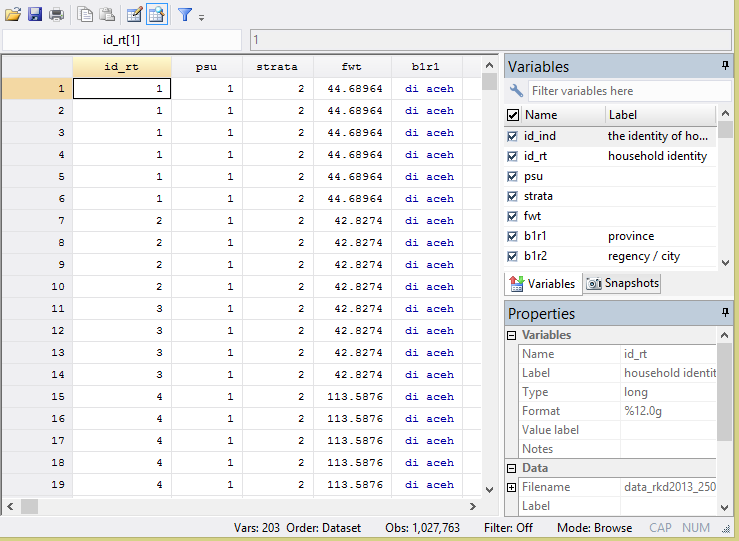
In 2013, it is apparently a little bit different, We have found components in the template without "inflate". The information that we have such as:
"PSU (primary sampling unit)
Strata and fwt" like below

Then, We declare the data survey:
Code:
svyset, clear
set mem 1000 m
svyset (pweight = fwt), strata (STRATA)
svyset (pweight = fwt), psu (PSU)
save, replace

In another hand, after we discuss with our colleague, who said in 2007 survey
http://labmandat.litbang.depkes.go.i...07_English.zip, has a summary saying, essentially, that strata were district/cities, PSUs were census blocks or census sub-blocks), second stage units were households, in which all members were selected.
The -svyset- should be
Code:
svyset [pw = inflate], strata(strata) psu (psu)
and in 2013 survey
http://biofarmaka.ipb.ac.id/biofarma...0Riskesdas.pdf , apparently says that PSUs are census blocks (sub-blocks?)) chosen from a master list with probability proportional to size. Thus there was no explicit stratification. In each PSU, the second stage of sampling was buildings or households.
The recommended svyset.
Code:
svyset [pw = fwt] , psu(psu)
Based on discussion, I compared the result of - svyset - like below
The -svyset- in 2007 survey
Firstly
Code:
svyset [pw=inflate], strata(strata) psu psu)
and output here :
. svydes
Survey: Describing stage 1 sampling units
pweight : inflate
VCE: linearized
Single unit: missing
Strata 1: strata
SU 1: psu
FPC 1: <zero>
#Obs per Unit
----------------------------
Stratum #Units #Obs min mean max
-------- -------- -------- -------- -------- --------
499 2 118 51 59.0 67
500 36 3,091 48 85.9 113
...
828 25 1,086 25 43.4 63
829 2 112 56 56.0 56
-------- -------- -------- -------- -------- --------
115 1,657 92,526 1 55.8 113
Secondly, I have compared with the -svyset- like below
Code:
svyset, clear
set mem 1000
svyset [pweight = weight], strata (strata)
svyset [pweight = weight], psu (psu)
svydes
and get output here
. svydes
Survey: Describing stage 1 sampling units
pweight : weight
VCE: linearized
Single unit: missing
Strata 1: <one>
SU 1: psu
FPC 1: <zero>
#Obs per Unit
----------------------------
Stratum #Units #Obs min mean max
-------- -------- -------- -------- -------- --------
1 1,656 92,526 1 55.9 113
-------- -------- -------- -------- -------- --------
1 1,656 92,526 1 55.9 113
The -svyset- in 2013 survey, like below :
Firstly
Code:
svyset, clear
svyset [pw = fwt] , psu(psu)
svydes
and the output here
svydes
Survey: Describing stage 1 sampling units
pweight: fwt
VCE: linearized
Single unit: missing
Strata 1: <one>
SU 1: psu
FPC 1: <zero>
#Obs per Unit
----------------------------
Stratum #Units #Obs min mean max
-------- -------- -------- -------- --------
1 1,514 130,585 6 86.3 159
-------- -------- -------- -------- --------
1 1,514 130,585 6 86.3 159
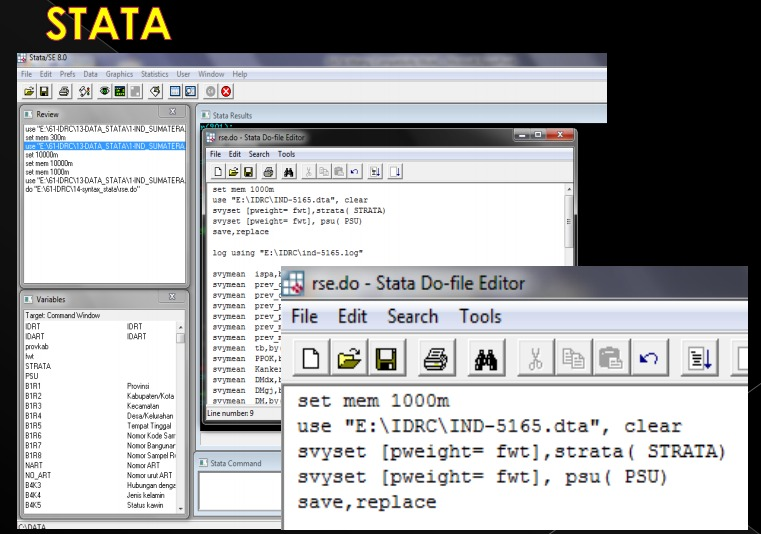
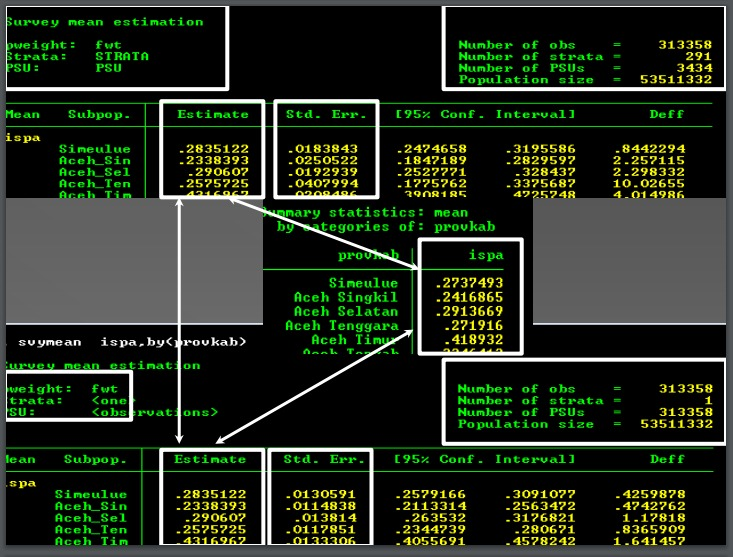
Secondly, The -svyset- compared to figure attached
Code:
svyset, clear
set mem 1000m
svyset [pweight = fwt], strata (strata)
svyset [pweight = fwt], psu (psu)
svydes
and the output here
. svyset [pweight = fwt], strata (strata)
pweight: fwt
VCE: linearized
Single unit: missing
Strata 1: strata
SU 1: <observations>
FPC 1: <zero>
. svyset [pweight = fwt], psu (psu)
pweight: fwt
VCE: linearized
Single unit: missing
Strata 1: <one>
SU 1: psu
FPC 1: <zero>
. svydes
Survey: Describing stage 1 sampling units
pweight: fwt
VCE: linearized
Single unit: missing
Strata 1: <one>
SU 1: psu
FPC 1: <zero>
#Obs per Unit
----------------------------
Stratum #Units #Obs min mean max
-------- -------- -------- -------- -------- --------
1 1,514 130,585 6 86.3 159
-------- -------- -------- -------- -------- --------
1 1,514 130,585 6 86.3 159
I would like to ask you again why the results number of observation of 5 provinces, in 2013 survey apparently significant different between results number of observation .svydes was {130,585} and others svyset was {14,512}, however in 2007 survey number of observation was same, between the .svydes was {92,526} and others svyset was {92,526 } like above? Which is the right command used to declare or set up the secondary data survey by STATA 12 or 14 version, both in 2007 and 2013 like attached? Do you have any insight about the problem?
I want to investigate connection amongst some "independent/explanatory variables" and one of "dependent variable" categoric, the outcome of this research is yes [sick] and not [healthy] influenced by some independent/explanatory variables.
The figures like similar as following :

The data will be analysed either descriptive, bivariate and multiple logistic regression analysis. In addition, multilevel logistic regression analysis may also be done if the National Socioeconomic Survey data obtained and combined as addition explanatory of variables [proxy of poverty of community issue]. Recently, we have the data of National health research data of 2007 and 2013 and National Socioeconomic Survey 2007. The National Socioeconomic Survey 2013 data have not obtained yet.
Please give me, advice and suggestion. Thank you very much in advance for your answer
--
Yours Sincerely,
Hamzah
-
 Attachment: stata1.png
(Size: 375.05KB, Downloaded 1389 times)
-
 Attachment: stata2.png
(Size: 410.56KB, Downloaded 1394 times)
-
 Attachment: 2007 Survey.PNG
(Size: 41.87KB, Downloaded 1445 times)
-
 Attachment: 2013 Survey.PNG
(Size: 46.66KB, Downloaded 1330 times)
[Updated on: Wed, 16 November 2016 02:08] Report message to a moderator |
|
|
|
|
|
Goto Forum:
Current Time: Mon Dec 15 12:31:44 Coordinated Universal Time 2025
|